It’s Easter week at Walt Disney World! As spring break season winds down, we thought it’d be worthwhile to take a look at wait time data and trends in the parks. This crowd report covers average waits at Magic Kingdom, Epcot, Hollywood Studios, and Animal Kingdom, while also offering a look forward at what to expect in May 2022 and beyond.
To quickly recap, attendance has been high for a while at Walt Disney World. January was elevated significantly as compared to last year and February was the busiest month in the last two years–before being barely edged out by March. Those two months had average wait times of 45 and 46 minutes, respectively.
Thus far, April 2022 has been identical to February. The two months are tied for the #2 month in the last two-plus years with an average daily wait time across all rides at Walt Disney World of 45 minutes. That’s the overarching story of crowds right now, but of course, there’s more nuance to the actual numbers. We’ll drill down on a park-by-park and ride-by-ride basis here…
Let’s dig into wait times and see to what’s up with April 2022 crowds for the first half of the month at Walt Disney World.
As always, all graphs and wait time stats are courtesy of Thrill-Data.com. While we reference them a lot here, I want to stop for a longer “plug” today. If you’ve never played around with that site, you really should check it out–Thrill Data covers everything from crowd levels and wait times to Lightning Lane availability.

Above is a high level look at monthly wait time averages across the entirety of Walt Disney World.
As of today (April 13, 2022), March holds the crown as the busiest month in the last two years at Walt Disney World. It currently has a 1 minute lead over this month, 46 v. 45 minutes on average. However, it is Easter week and Park Pass reservations are fully booked for the next two weeks…so that could still change.

If you break it down by week, you can also see how crowds thus far in April 2022 almost mirror March.
This week is the third-busiest week in the last two years, with an average wait time of 48 minutes.

Once we get into individual days, the graph becomes difficult to read–but you can still see two spikes towards the right side. The first is over the Presidents’ Day weekend and the second is during Orange County’s spring break. Crowds have more or less leveled off since then.
Personally, I’m expecting April 2022 to surpass March when all is said and done. My basis for this is character locations, which have dragged down averages in their “Sighting” form. With traditional character meet & greets with hugs, autographs, Top Gun high-fives, etc. returning next week, those wait times will increase significantly–potentially enough to move the needle on wait times as a whole.

For park by park analysis, we’ll start with Magic Kingdom.
Magic Kingdom wait times peaked in the second half of February and have yet to return to those same highs. With that said, we’re still talking 9/10 daily waits on average, but that’s better than the high 10s (as opposed to a low 10/10–there’s a difference!) the park was regularly hitting in late February.
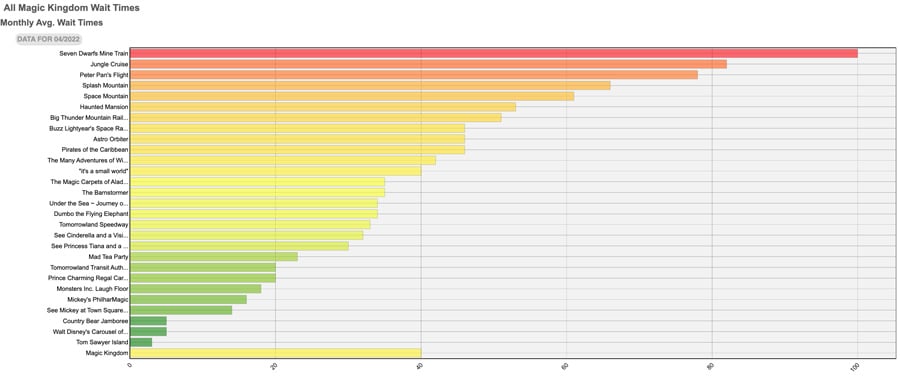
Here are the specific averages for April 2022:
- Seven Dwarfs Mine Train: 100 minutes
- Jungle Cruise: 82 minutes
- Peter Pan’s Flight: 78 minutes
- Splash Mountain: 66 minutes
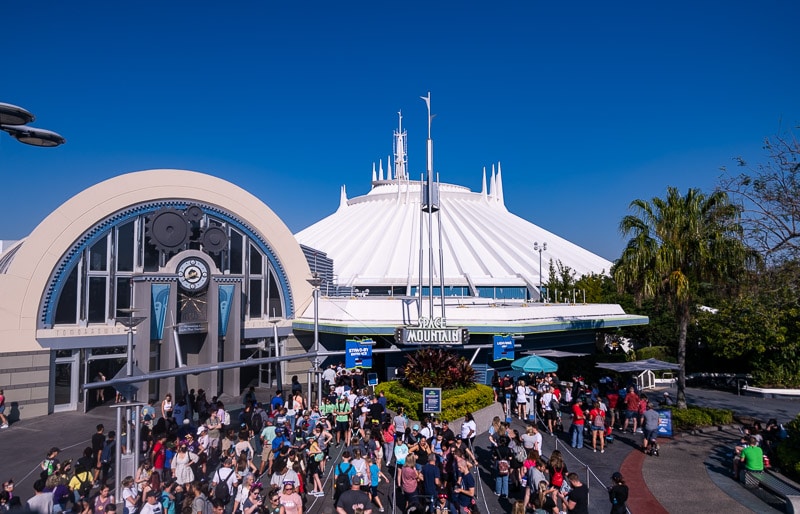
- Space Mountain: 61 minutes
- Haunted Mansion: 53 minutes
- Big Thunder Mountain Railroad: 51 minutes
Seven Dwarfs Mine Train (+1) and Jungle Cruise (+5) are the only headliners that have had higher wait times this month. Wait times have also increased at a variety of lower profile rides.

It’s a similar story at Animal Kingdom.
There, wait times have fallen considerably from their late February peaks. Still, the range has been 7/10 to 9/10 both this and last month, with a few weather-related anomalies sprinkled in.
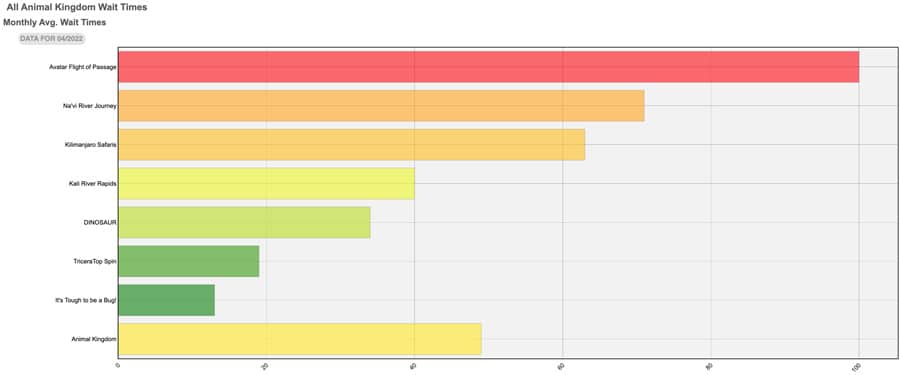
Here are the specific averages for April 2022:
- Avatar Flight of Passage: 100 minutes
- Na’vi River Journey: 71 minutes
- Kilimanjaro Safaris: 63 minutes
- Kali River Rapids: 40 minutes
- Dinosaur: 34 minutes
The few other attractions in Animal Kingdom are all below 20 minutes.
Also relevant here is that Expedition Everest is still for refurbishment (in case you missed it, that has turned into an indefinite closure). In another park, this would displace guests and result in higher waits elsewhere. To some extent, that’s probably happening. However, with so few rides in Animal Kingdom, it’s more likely that people are just finishing the park faster and leaving earlier. That would also explain some of the drop-off in average wait times.

We continue along to Epcot.
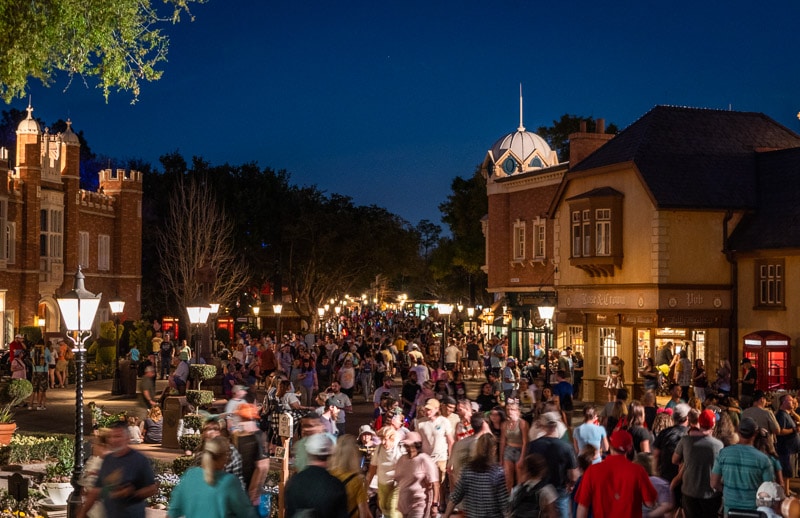
Again, nothing here even remotely on par with Presidents’ Day weekend. Although the 2022 Epcot Flower & Garden Festival is now underway, that hasn’t really moved the needle on these crowd levels. Don’t let the lighter lines fool you–with the exception of April 1-2, crowd levels have been in the 7/10 to 9/10 range all month.
Obligatory Epcot reminder: this is wait time data, which is correlated to but not of conclusive of attendance. Wait times are an imperfect measure of crowds–yadda yadda yadda–but the best measure that exists.
Epcot is notorious for higher “feels like” crowds in World Showcase during festivals and on weekends and evenings. Weekends are busier for drinking and evenings are busier for people Park Hopping over to watch Harmonious. In short, people show up for things other than attractions, so that elevated attendance isn’t picked up by wait time data.
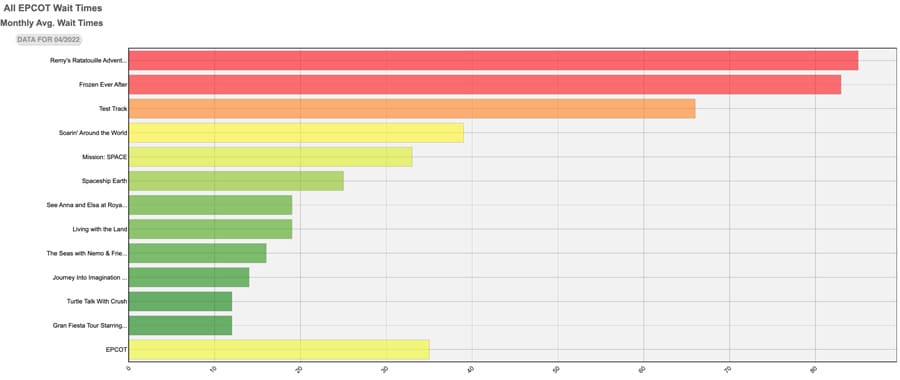
As for specific attraction wait times at Epcot, here’s what we have for the first half of April 2022:
- Remy’s Ratatouille Adventure: 85 minutes
- Frozen Ever After: 83 minutes
- Test Track: 66 minutes
- Soarin’ Around the World: 39 minutes
- Mission Space: 33 minutes

Finally, there’s Disney’s Hollywood Studios.
If there’s a silver lining in this crowd report, it’s that weekly wait times have been falling at DHS since the week of Orange County’s spring break in mid-March. After peaking at an extraordinary 76 minutes, DHS wait times bottomed out at 54 minutes last week. That’s still high enough to make it a 9/10 crowd level, but a 22 minute differential is huge. Given that Disney’s Hollywood Studios is Walt Disney World’s toughest park to tour, that’s welcome relief.
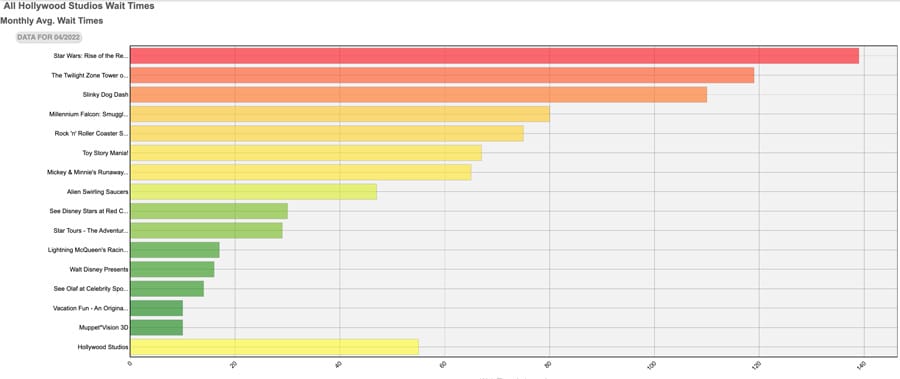
Here are ride-by-ride wait times for Disney’s Hollywood Studios in April 2022:
- Star Wars: Rise of the Resistance: 139 minutes
- Twilight Zone Tower of Terror: 119 minutes
- Slinky Dog Dash: 110 minutes
- Millennium Falcon Smugglers Run: 80 minutes
- Rock ‘n’ Roller Coaster: 75 minutes
- Toy Story Mania: 67 minutes
- Mickey & Minnie’s Runaway Railway: 65 minutes
- Alien Swirling Saucers: 47 minutes
As a reminder, Twilight Zone Tower of Terror is operating at half-capacity due to a “stealth” refurbishment, which is why it is the #2 wait time at DHS right now and likely will be through at least the first half of summer.
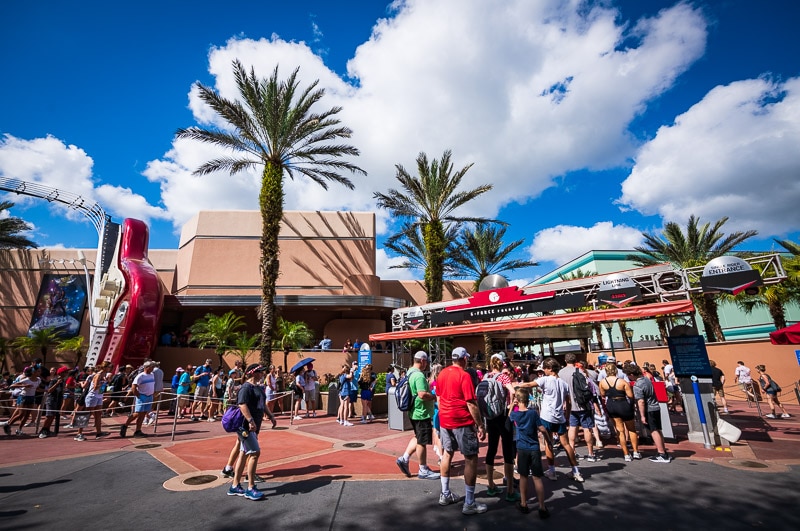
On another positive note, the 8 am official park opening time makes it easier to minimize wait times at Disney’s Hollywood Studios, especially if you’re staying on-site. See our post on Early Entry at Disney’s Hollywood Studios that covers doing both Star Wars: Rise of the Resistance and Mickey & Minnie’s Runaway Railway before the park opened to regular guests. (Although now you’d be better suited bouncing from Galaxy’s Edge to Sunset Boulevard rather than Grauman’s Chinese Theatre.)
Additionally or alternatively, there’s Genie+ and Lightning Lanes. Even if you’re only able to knock out 3-4 headliners with the paid FastPass service, Genie+ is arguably worth it at Disney’s Hollywood Studios. Read about My Day Using Genie+ Lightning Lanes in Peak Crowds at Disney’s Hollywood Studios and follow our Speed Strategy for Genie+ Selections and DHS Lightning Lane Ride Ranks to max out your Genie+ count at Disney’s Hollywood Studios.
Looking forward, you can expect more of the same for…who knows how long. I’m planning an update to our May 2022 Crowd Calendar for Walt Disney World that’ll almost certainly revise numbers upward across the board. My only hesitation at this point is Guardians of the Galaxy: Cosmic Rewind AP preview dates and seeing whether any other dates start going yellow or grey on the Disney Park Pass reservation calendar. (As covered earlier this week, Disney Park Pass availability is incredibly limited for the rest of this month and parts of May 2022.)
Since mid-February, every week except one has been a crowd level 9/10 or 10/10 at Walt Disney World (that one exception was an 8/10). The average wait time has ranged from 44 to 51 minutes during that time. Let that sink in: a 7 minute range over the course of 2 months. That’s not insignificant (it all adds up!), but it’s also not on par with normal times, when could swings of 10 minutes week-to-week were common.
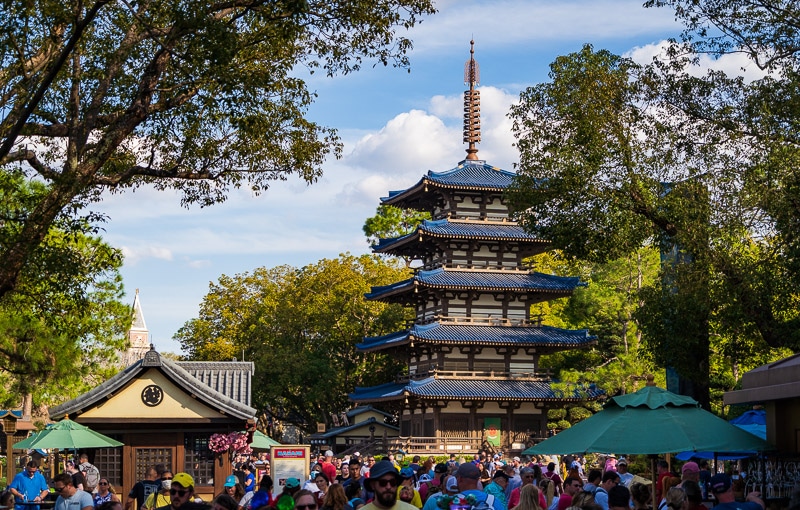
There have been greater fluctuations in daily wait time data, but even that is still well below normal. The problem, and the reason we’re disinclined to stress those numbers, is that they’re almost entirely unpredictable when advance-planning. Sure, it’s an incredibly safe bet to say that Magic Kingdom is going to be least crowded on the days it closes at 4:30 pm for Cast Member Service Celebrations. But those don’t happen with any degree of regularity, and the far more common predictors of daily wait time disparities are attraction downtime and weather.
In other words, you’d literally be better off listening to a meteorologist than reading one of our crowd calendars right now. Obviously, I wish that weren’t the case, and I’m still hopeful that we’ll see a reprieve from the last several months of crowds sometime in May 2022. But “hope” isn’t exactly a solid foundation for attendance forecasts, so I hesitate to make any bold prognostications.
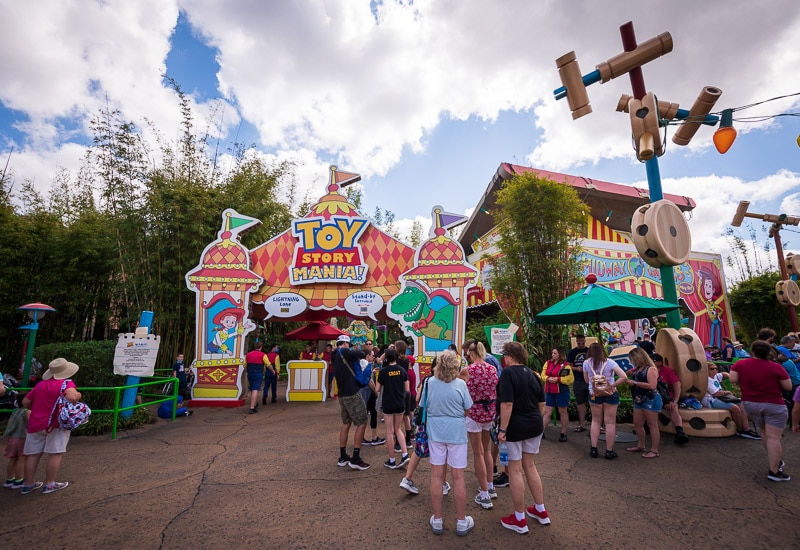
At this point, pretty much every outcome-determinative variable for attendance is outside the purview of traditional crowd level forecasting. Right now, it’s less about school calendars, travel seasons, etc., and more about real world considerations unique to this moment in time.
To wit, how will pent-up demand play out among domestic and international visitors? Will oil prices remain elevated or normalize? What about inflation? Will there be a pullback in consumer spending, and if so, will it impact travel or be mostly confined to goods? There are a dozen more questions like this, and there are no definitive answers. (If I had confidence in my answers, I’d be playing the markets, not crowd calendars.)
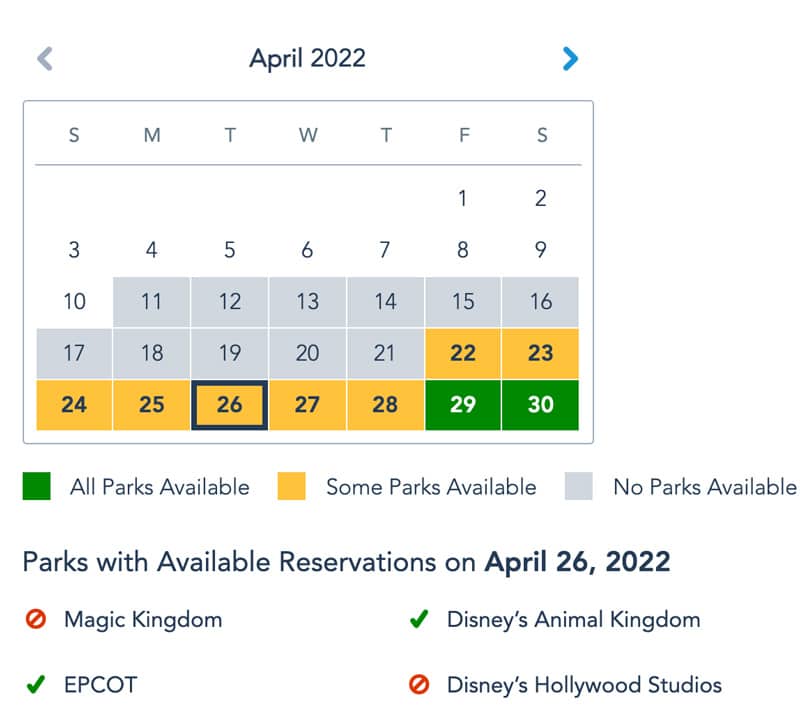
So, what needs to change before we can have more confidence in crowd calendars? At minimum, the Disney Park Pass reservation calendar needs to change from a sea of grey to more yellow and, ideally, green. Crowd calendars are literally useless when it’s all grey–fully booked is fully booked from a predictive perspective. (Again, daily wait time numbers will vary due to attraction downtime and other variables, but nothing anyone can forecast.)
I’d also like more clarity about some of the aforementioned questions encompassing everything from the economy to geopolitical risk to household balance sheets. All of that is what the kids call a “big ask” but I’m reasonably optimistic we’ll have better insight into some of these things in the coming couple of months.
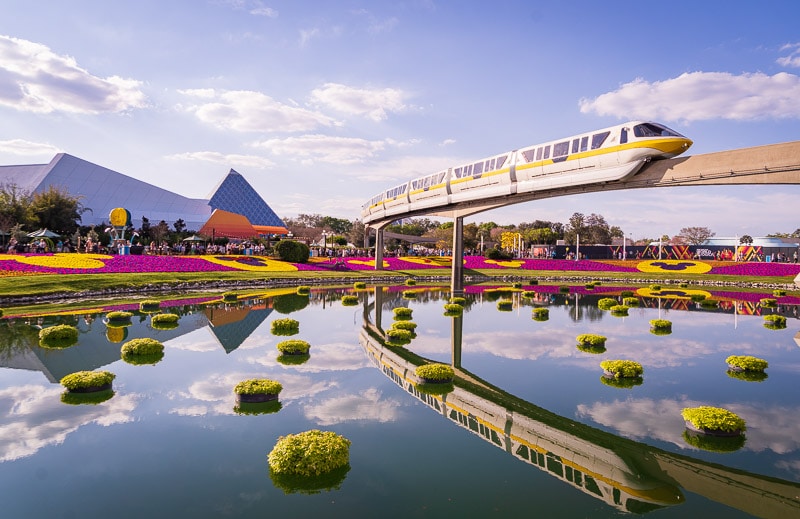
For now, the only thing I’m reasonably comfortable predicting is that crowds will fall off around mid-August and remain that way through at least late September. That’s always a safe bet, and the lone window of time that has yet to buck conventional wisdom on crowds. (Knock on wood.) Whether May through early June will see a slowdown is less clear, as is pretty much everything after the fall.
With that said, it’s not all doom and gloom. It’s easier to beat crowds at Walt Disney World right now than it has been in a long time. Significantly earlier opening times provide a huge advantage to early risers, and savvy strategy or advanced-level know-how with Genie+ and Lightning Lanes can be a gamechanger. Setting aside congestion, we’ve honestly found it easier to tackle Epcot, Hollywood Studios, and Animal Kingdom since these extended hours started in early March.
To that end, we (once again) recommend checking out Genie+ v. Savvy Strategy at Walt Disney World, which is the result of extensive ‘testing’ to determine the best and worst ways to beat the crowds. (If you only read one strategy post, make it that.) Genie+ is only the clear winner at Magic Kingdom. In the other 3 parks, there are superior strategies for saving time waiting in line.
For more granular, step-by-step advice, be sure to use our Walt Disney World Itineraries for plans of attack, with options now with and without Genie+ and Lightning Lanes. Speaking of which, we have a ~4,500 word Guide to Genie+ at Walt Disney World & Lightning Lane FAQ for those who want to thoroughly master the new paid FastPass system.

Basically, all of this is a long-winded way of saying that strategy matters more right now than crowd calendars. That has arguably been the case since ~2018, but it’s more pronounced than ever right now. With Disney Park Pass reservations booking up on a daily basis, crowds are largely being leveled and not reflective of actual, organic demand. That presumably does vary much more day-to-day or week-to-week, but that’s not playing out with the capacity caps in place.
As we often say, pack your patience and arm yourself with savvy strategy if you’re visiting Walt Disney World in the coming weeks or months. The bad news is that it’s going to be very busy with “feels like” crowds and wait times among the highest we’ve seen in the last two years. The good news is that these crowds are more “beatable” than those of this winter or last holiday season.
Planning a Walt Disney World trip? Learn about hotels on our Walt Disney World Hotels Reviews page. For where to eat, read our Walt Disney World Restaurant Reviews. To save money on tickets or determine which type to buy, read our Tips for Saving Money on Walt Disney World Tickets post. Our What to Pack for Disney Trips post takes a unique look at clever items to take. For what to do and when to do it, our Walt Disney World Ride Guides will help. For comprehensive advice, the best place to start is our Walt Disney World Trip Planning Guide for everything you need to know!
YOUR THOUGHTS
Thoughts on crowds during the spring break season last month and through April 2022? Predictions on crowds for May 2022? Think that this month will end up surpassing March? If you’ve taken advantage of the earlier park opening times, how well did that strategy work out for you? If you’ve visited within the last month, what did you think of crowds and wait times? Any parks or times of day noticeably worse than the others? Do you agree or disagree with anything in our report? Any questions we can help you answer? Hearing your feedback–even when you disagree with us–is both interesting to us and helpful to other readers, so please share your thoughts below in the comments!
"wait" - Google News
April 14, 2022 at 12:35AM
https://ift.tt/kaXNbo8
Spring Sees Peak Season Wait Times at Disney World - Disney Tourist Blog
"wait" - Google News
https://ift.tt/JEt46ap
https://ift.tt/VGCOtbj
Bagikan Berita Ini


0 Response to "Spring Sees Peak Season Wait Times at Disney World - Disney Tourist Blog"
Post a Comment